How to Embed an Interactive Radar Chart on Your Website
A static screenshot of a chart goes stale the moment your data changes. An embedded radar chart stays live, responds to hover, and updates automatically when you edit the source. This guide walks through the exact two-minute flow in RadarChart.io, where embeds work, and how to make them responsive.
Why embed instead of pasting a screenshot
An embedded chart is interactive: readers hover an axis to see exact values, toggle entities on or off, and see crisp vector rendering on every screen — no blurry retina-resampled PNG. It's also live. Edit the underlying chart once and every page that embeds it updates the next time the page loads, with no re-export and no broken image links.
Embeds are also lighter than they look. The iframe loads ~30KB of HTML and a small chart bundle, lazy-loads by default, and inherits the host page's width so it stays responsive. Compared to maintaining a folder of PNG exports across a docs site or knowledge base, embedding is dramatically less work.
Step-by-step: copy the embed code
1. Open the chart you want to share in the RadarChart.io builder. If you haven't built one yet, start from a template or paste your data.
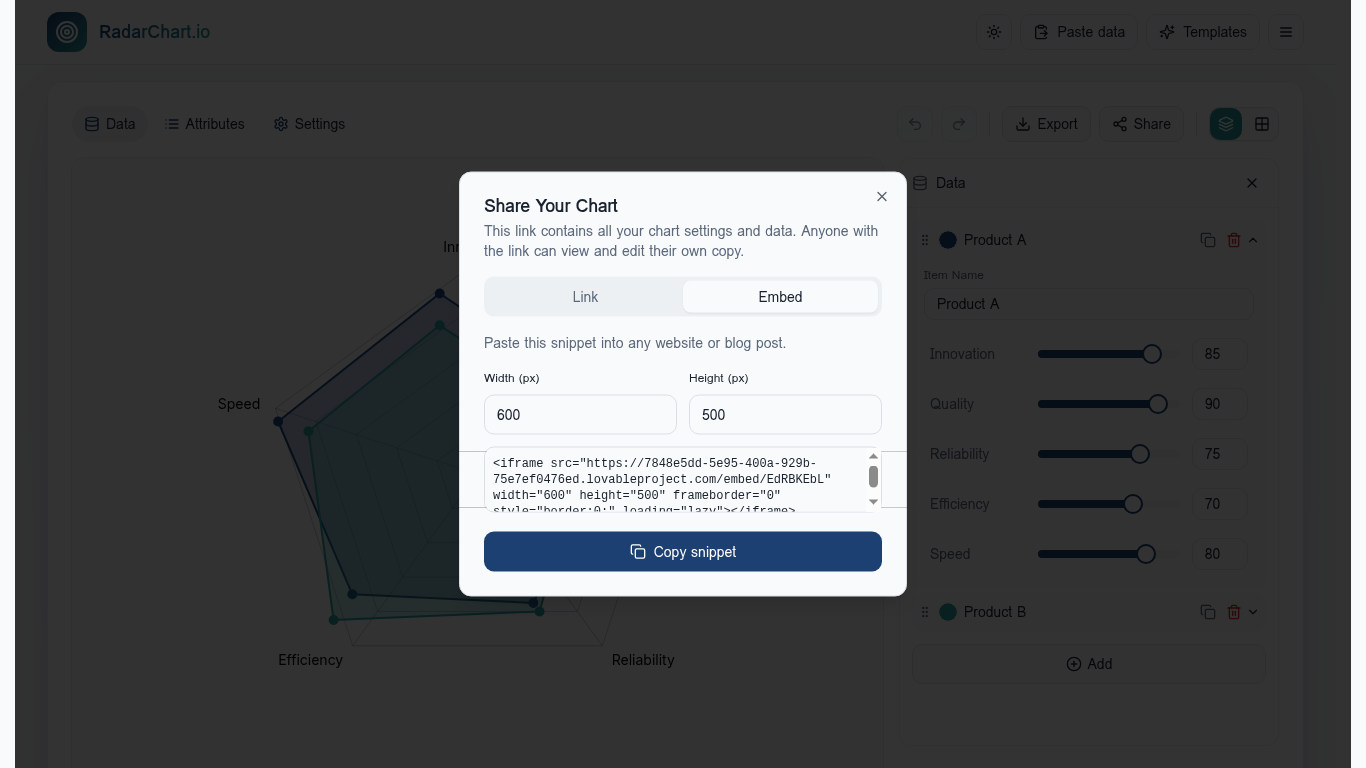
2. Click Share in the top toolbar. Switch from the Link tab to the Embed tab.
3. Set the width and height in pixels (600 × 500 is a good default for blog posts; widen to 800 × 600 for documentation pages).
4. Click Copy snippet. You'll get an iframe tag like the one below — paste it anywhere HTML is allowed.
Where it works
Plain HTML / static sites: paste the snippet directly into any .html file or template.
WordPress: add a Custom HTML block and paste the snippet — works on both wordpress.com Business plans and self-hosted WordPress.
Ghost: use an HTML card inside the editor and paste the snippet.
Notion: type /embed, paste the share link (the /embed/<id> URL works directly), and Notion will render it inline.
Confluence: insert the Iframe macro and paste the embed URL as the source.
Webflow & Framer: drop in an Embed element and paste the snippet.
Medium and Substack don't allow raw iframes. Paste the share link instead — both will render a clickable preview card using the page's OG image.
Making the embed responsive
The default snippet uses fixed pixel dimensions, which is fine for fixed-width blog templates. For fluid layouts, wrap the iframe in a container and use CSS aspect-ratio:
<div style="max-width:800px;aspect-ratio:6/5;"> <iframe src="…/embed/<id>" style="width:100%;height:100%;border:0;" loading="lazy"></iframe> </div>
The chart re-flows on resize, so the iframe will look correct at any width from a phone (~320px) up to a wide desktop column.
Keeping the embed up to date
The iframe points at a share ID, and that ID resolves to the current saved state of your chart. When you reopen the chart in the builder, edit a value, and save a new version (use the Share dialog's Link tab to update the same ID), every page embedding that ID picks up the change on next load. There's no cache to bust and no file to re-upload.
View counts are tracked per share ID and visible from your shared charts list, so you can see which embeds are actually getting reads.
SEO and performance notes
The snippet includes loading="lazy" so the iframe only fetches when it scrolls into view — no impact on your page's initial paint or Core Web Vitals. The embed page itself is marked noindex, so it won't compete with your host page in search results; Google attributes the content to your page, not to RadarChart.io.
If a reader has JavaScript disabled, the iframe simply renders nothing — pair the embed with a short text summary or a fallback PNG export for maximum accessibility.
Alternatives if you can't embed
For platforms that block iframes (some intranets, locked-down email clients, print PDFs), export a high-resolution PNG or vector SVG from the Export menu and drop that in instead. You lose interactivity but keep the crisp brand-matched styling. For social posts where you want a rich preview, paste the share link — RadarChart.io renders a chart-specific Open Graph image automatically.
Related templates
Competitor Benchmark Chart
Free competitor benchmark template — plot your product against top competitors on adoption, innovation, UX, price-value, and brand trust in a single radar chart.
Product Comparison
Compare multiple products on factors like price, usability, performance, reliability, support, and integrations.
Skill Assessment
Compare your proficiency across areas like communication, leadership, technical, creativity, and strategy.